3. Jupyter Notebooks 
The nbsphinx extension allow notebooks to be seemlessly integrated into a Sphinx website. This page demonstrates how notebooks are rendered.
3.1. facebook 
|
asfasdfasdfasdf |
asdfasdf |
asdfasdf |
asdfasdfasdf |
asdfasdfasdfasdf |
|---|---|---|---|---|
|
1324 |
2 |
2 |
1 |
1 |
|
1234 |
2 |
2 |
1 |
1 |
|
1234 |
2 |
2 |
2 |
1 |
|
Stretch/Untouched |
ProbDistribution |
Accuracy |
|---|---|---|
|
Stretched |
Gaussian |
.843 |
[1]:
from IPython.display import HTML, display
import tabulate
table = [["Sun",696000,1989100000],
         ["Earth",6371,5973.6],
         ["Moon",1737,73.5],
         ["Mars",3390,641.85]]
display(HTML(tabulate.tabulate(table, tablefmt='html')))
---------------------------------------------------------------------------
ModuleNotFoundError                       Traceback (most recent call last)
<ipython-input-1-201bedb9287d> in <module>
      1 from IPython.display import HTML, display
----> 2 import tabulate
      3 table = [["Sun",696000,1989100000],
      4          ["Earth",6371,5973.6],
      5          ["Moon",1737,73.5],

ModuleNotFoundError: No module named 'tabulate'
3.2. DataFrames 
pandas DataFrames are rendered with useful markup.
[2]:
import numpy as np
import pandas as pd

df = pd.DataFrame({'ints': [1, 2, 3],
                   'floats': [np.pi, np.exp(1), (1+np.sqrt(5))/2],
                   'strings': ['aardvark', 'bananarama', 'charcuterie' ]})

df
[2]:
| ints | floats | strings | |
|---|---|---|---|
| 0 | 1 | 3.141593 | aardvark |
| 1 | 2 | 2.718282 | bananarama |
| 2 | 3 | 1.618034 | charcuterie |
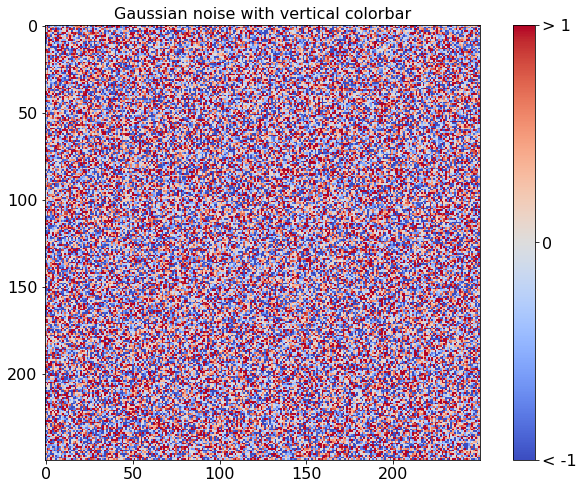
3.3. Plots and Figures 
matplotlib can be used to produce plots in notebooks
This example comes from the matplotlib gallery .
[3]:
%matplotlib inline

import numpy as np
import matplotlib.pyplot as plt
from matplotlib import cm

fig, ax = plt.subplots(figsize=(12,8))

data = np.clip(np.random.randn(250, 250), -1, 1)

cax = ax.imshow(data, interpolation='nearest', cmap=cm.coolwarm)
ax.set_title('Gaussian noise with vertical colorbar', fontsize=16)
plt.tick_params(labelsize=16)

# Add colorbar, make sure to specify tick locations to match desired ticklabels
cbar = fig.colorbar(cax, ticks=[-1, 0, 1])
cbar.ax.set_yticklabels(['< -1', '0', '> 1'])  # vertically oriented colorbar
cbar.ax.tick_params(labelsize=16)